
We offer a wide range of gifts that you can design and personalise with your favourite photos. But not just that, we also have plenty of creative ideas to help you personalise your gifts in a unique way.
From step-by-step instructions for DIY photo projects to ideas for the perfect table decoration and tips on taking photos, we’re here to help you make the most of your gifts and photo products.
Drop in regularly for fresh inspiration and let your creativity flow!
Filter products
Filters
Authors
Topics
Categories

Self-customizable calendars: year-round joy
Ifolor Wall Calendars and Monthly Planners celebrate your story. Self-customizable photo calendars are the perfect way to make every month feel special.

Photo Book Fast
Creating a photo book can be quite time-consuming. With these tips you’ll be able to design your own personal photo book in less than 4 hours.

Creative upcycling ideas:
Photo calendars serve us faithfully all year round, and, with a little creativity, we can give them a second lease of life rather than throwing them in the bin. Here are eight eco-friendly upcycling ideas to give your photo calendar a long-term future.

Capture winter photo moments
Capture your best winter holiday photos as impressive wall decorations, personalised photo gifts, or lovingly designed photo books.

Capture your family memories in a photo book
Create lasting childhood memories with a photo book. These ideas will help you gather your special moments between the covers and turn precious childhood photos into a physical memento.
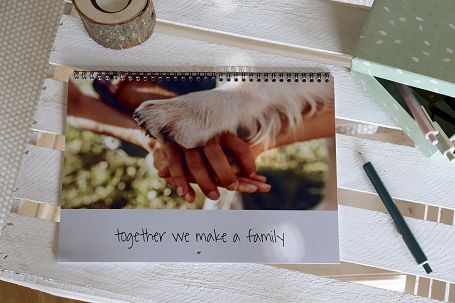
Organise your days with the ifolor Monthly Planner
Keep all of your important events at a glance, with the ifolor monthly planner. Personalise your calendar and even enter your own public holidays. Discover now!

Family Photo Book
Use our creative photo book design tips to create a unique family yearbook full of memories to share with your loved ones

Creative ideas for organising your family
Use these creative organisational ideas to keep on top of things: Create a beautiful organisation chart for the whole family!
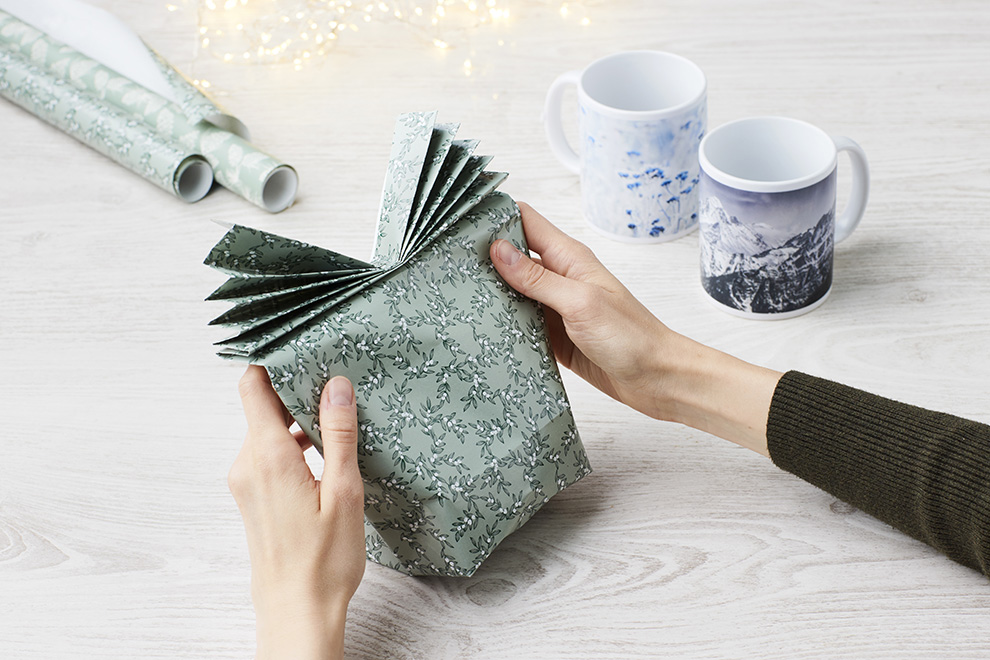
Gift-wrapping tip: a clever bow bag
What better way to delight your loved ones than a beautifully wrapped present that contains several surprises? Check out this gift-wrapping tip that is perfect for photo mugs!

Enrich your photo gifts with a lovely poem
Add a beautiful poem to your photo gifts for that special touch. Get inspired to create a fantastic gift for any occasion.
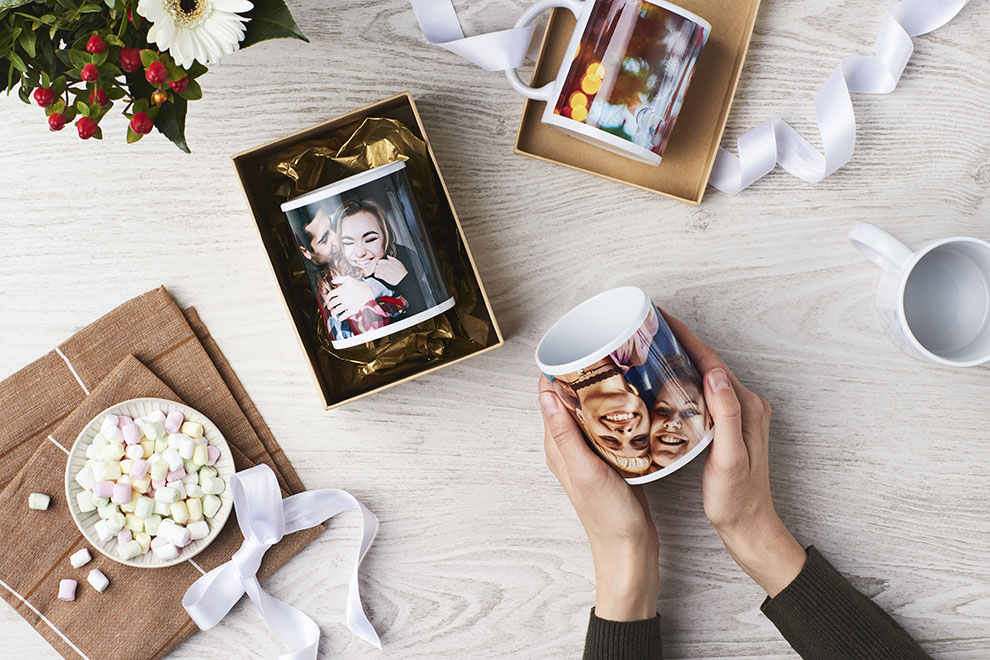
These budget-friendly Christmas gifts are full of meaning
Christmas gifts don't have to leave a dent in your wallet to be special. Check out these inexpensive gift ideas for budget presents.

Designing last-minute Christmas gifts
In just a few minutes you can create great photo gifts for Christmas using your best photos. We'll show you how easy it is with ifolor.
Photo Christmas gifts for your parents
Buying your parents a Christmas gift is not easy. We show how you can create personalised photo gifts for your parents this Christmas.

How to wrap your photo gift ecologically using a T-shirt
Avoid the wasteful use of paper and wrap your presents ecologically in a T-shirt. Follow the steps to turn a T-shirt into a personalised package for Father’s Day or Christmas.

Solve your Christmas gift problems in an instant
A photo calendar is a personalised Christmas gift that brings joy every day of the year. Here’s some reasons why photo calendars make the best gift.

Create decorative Christmas gifts
Create a Christmas mug, personalised blanket, and more as decorative Christmas gifts with a personal touch. Get inspired now.

A photo book is a personal gift
A photo book can bring joy or comfort, be silly or even help you pop the question. It's a personal gift. Save these unique gift ideas for later!

Original Christmas gifts with a personal touch
Surprise your loved ones this Christmas with creative and useful gifts with a personal touch: your own photos.

Individually Design Your Wall Decorations with Photo Canvases
We will show you how to individually design a photo collage or a multipiece canvas, which you can then hang up to decorate your home.
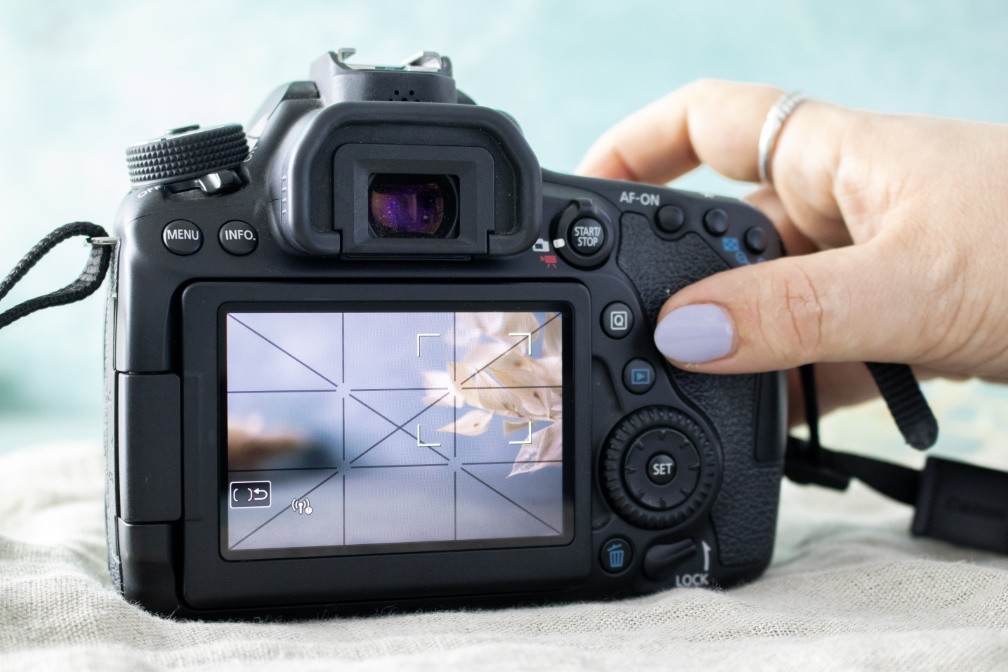
The right perspective
Displaying your photos correctly can turn a good photo into a great one. We have six tips to show you how to best display your photos.

Travel yearbook
Follow our helpful tips to design your own fantastic travel yearbook full of memories and your favourite holiday photos.
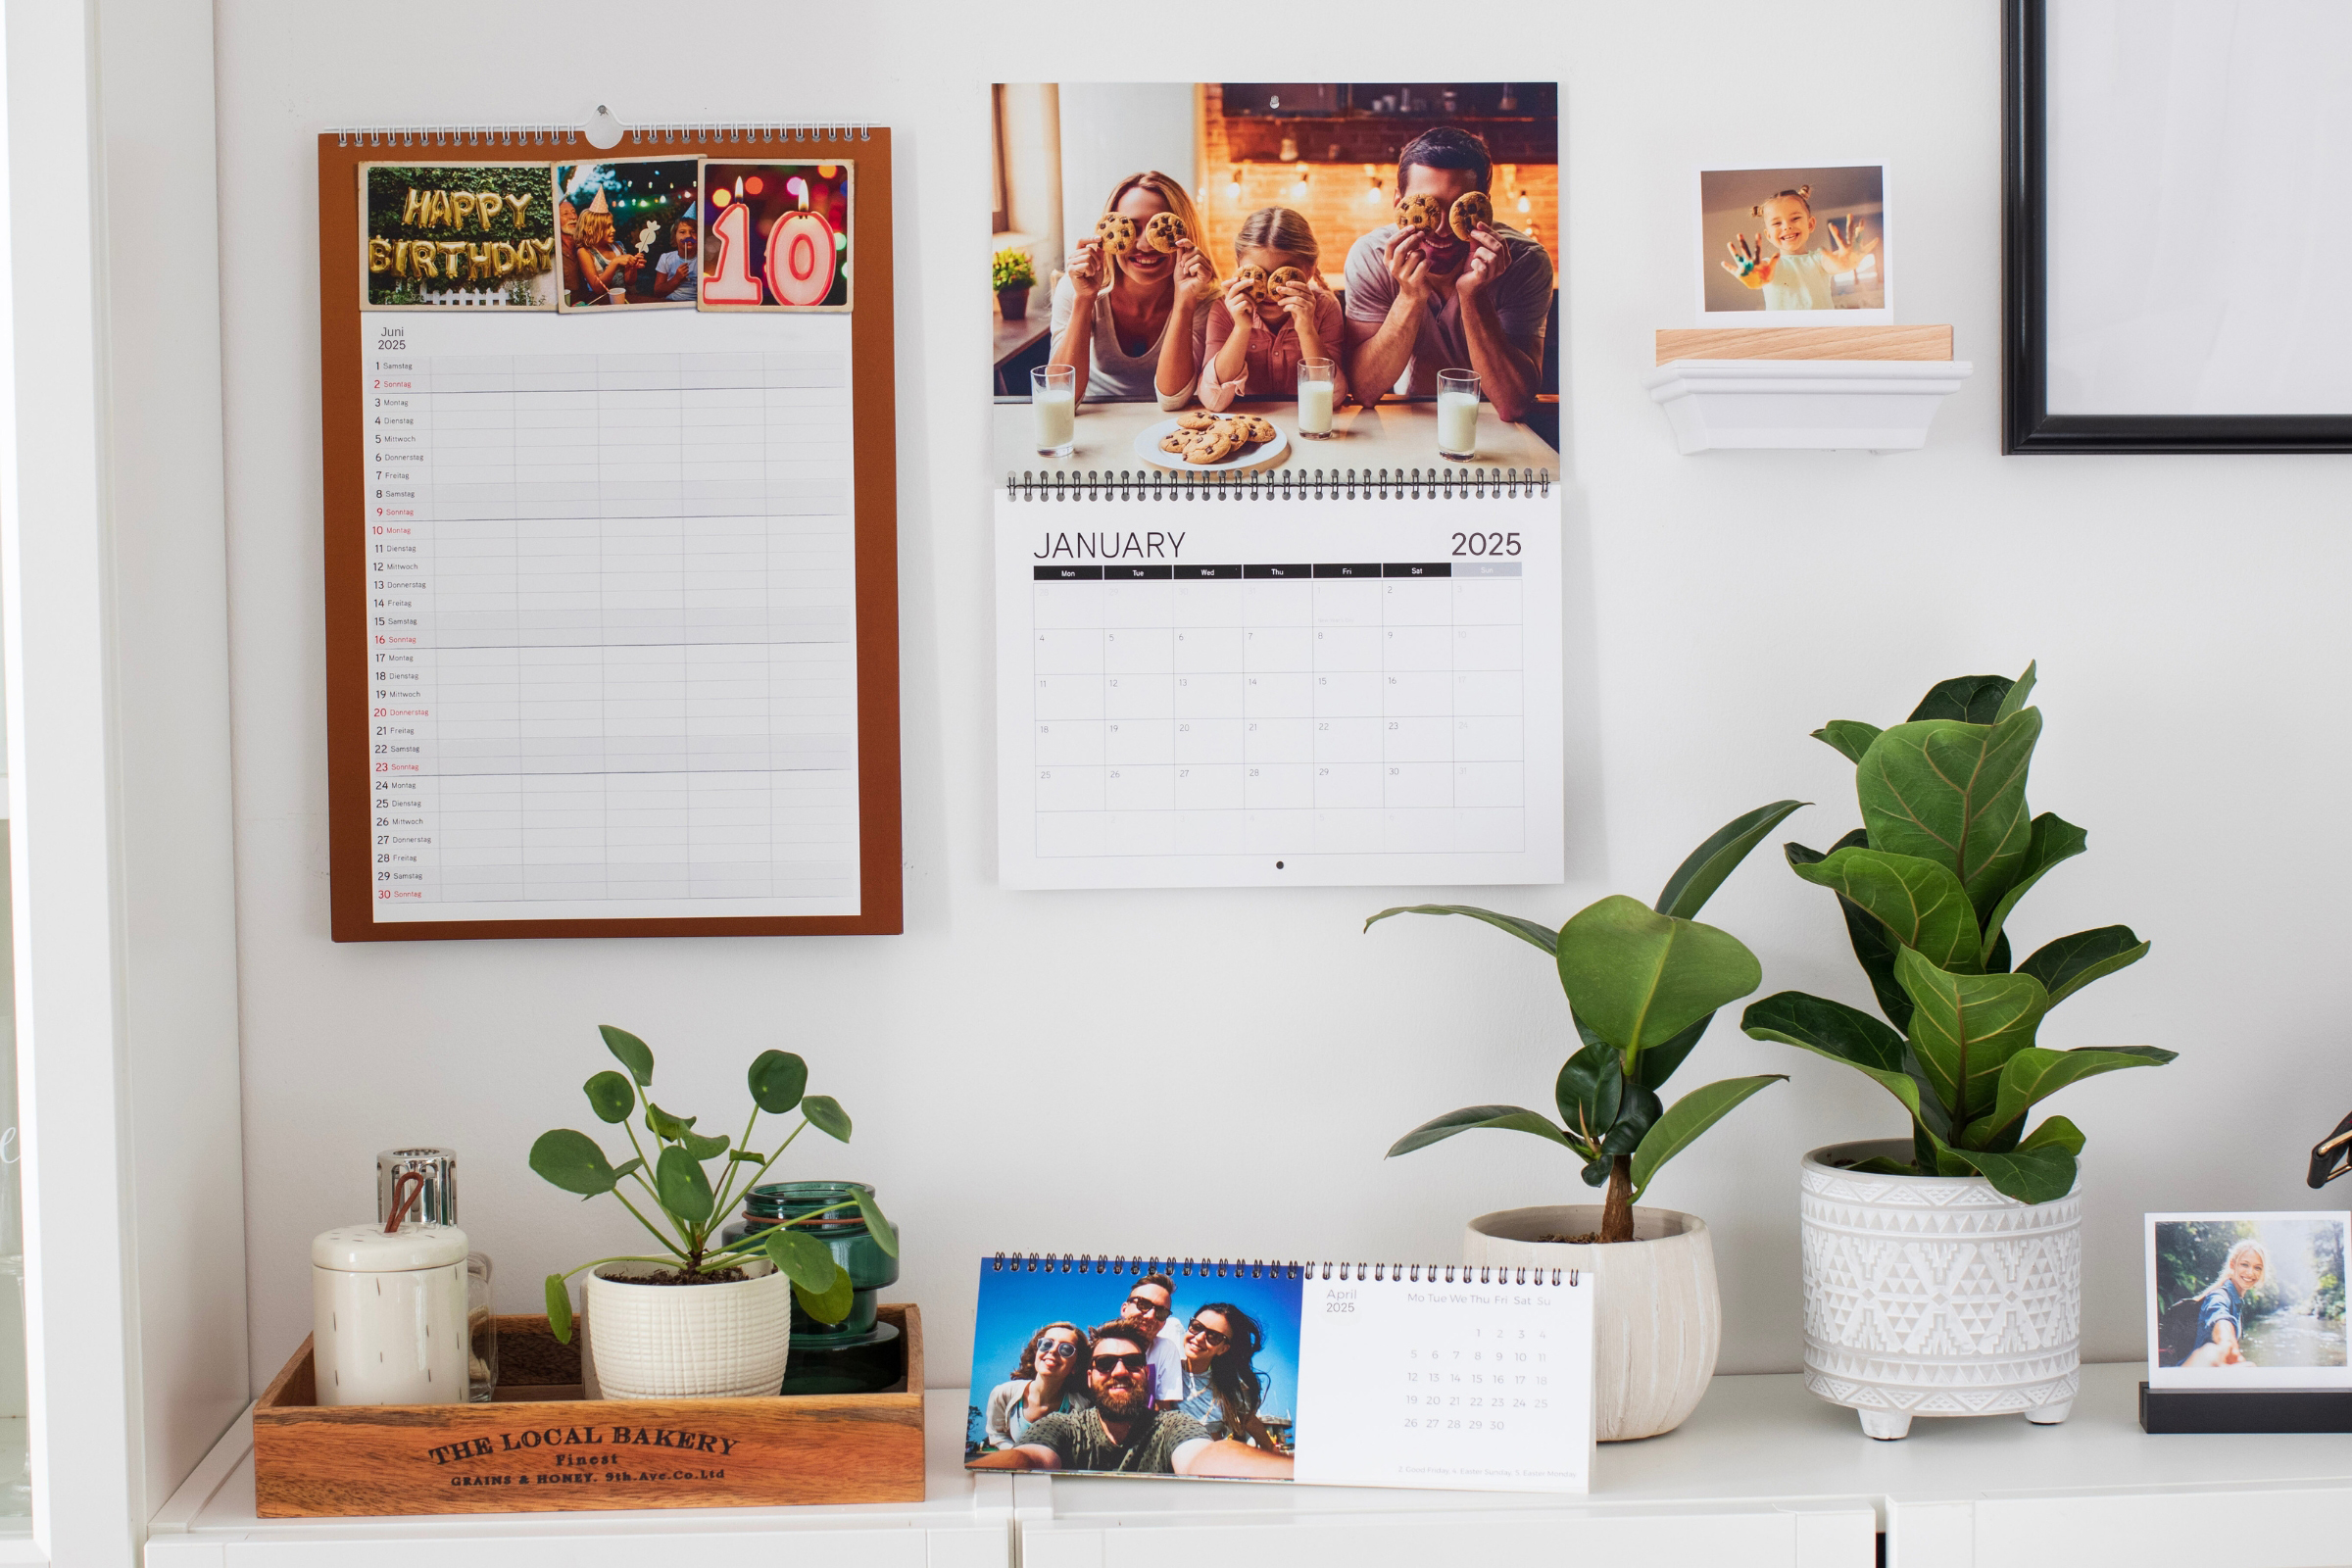
Create individual ifolor Photo calendars
Classic, Panorama, including writeable monthly pages and more: Design your own Photo calendar individually & even enter your own holidays.
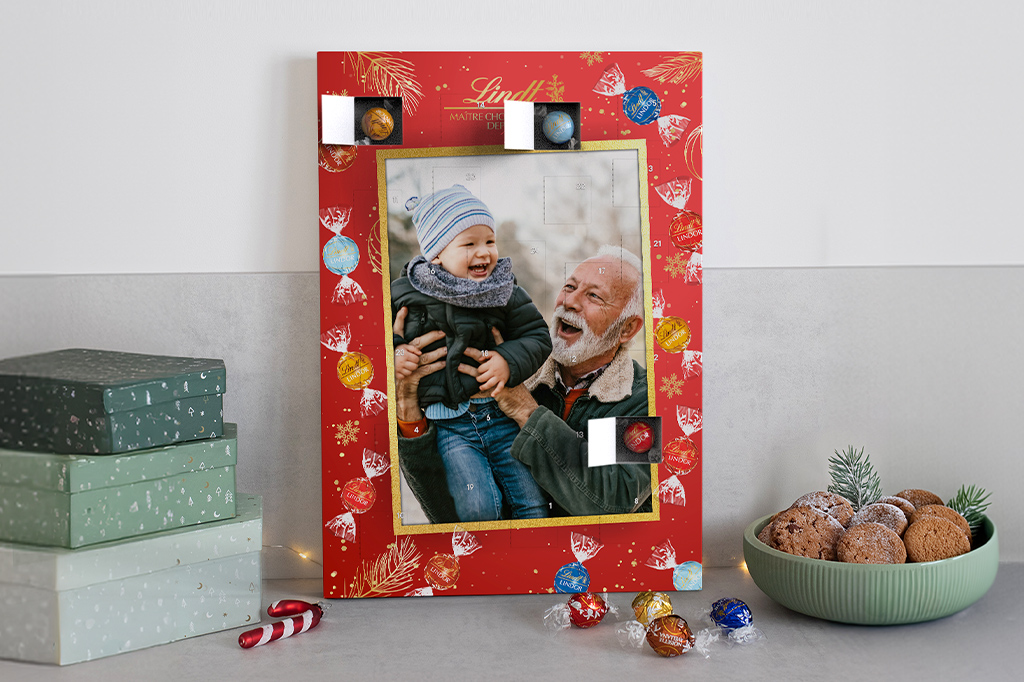
Personalised Photo Advent Calendar with Lindt chocolate
Sweeten the pre-Christmas season for your loved ones with a personalised photo advent calendar filled with delicious Lindt chocolate. Order now!

Leica Look Made Easy: How to Achieve the Iconic Style with Your Own Camera
Discover the Secrets of the Leica Look ✓ Tips on Equipment, Camera Settings & Post-Processing ✓ Including Checklist Download
